TPOS 2023 · Central tropical Pacific
A saildrone in the tropical Pacific
In the summer of 2023, three uncrewed sailing drones left Hawaiʻi for the equator. They carried no one, ran on wind and sunlight, and stayed at sea for five months. This is where one of them went.
- Days on the track
- 144
- Kilometres sailed
- 7,800+
- Positions logged
- 557
- Sea surface
- 25.4–30.0 °C
Three drones and no crew
TPOS Mission 6 began its sea trials on 24 May 2023, when three Saildrone Explorer vehicles, SD1030, SD1033 and SD1079, left Hawaiʻi. It was run by the Ocean Climate Station project of NOAA's Pacific Marine Environmental Laboratory, as part of an effort to strengthen the Tropical Pacific Observing System, the instruments that keep watch on the ocean where El Niño begins.
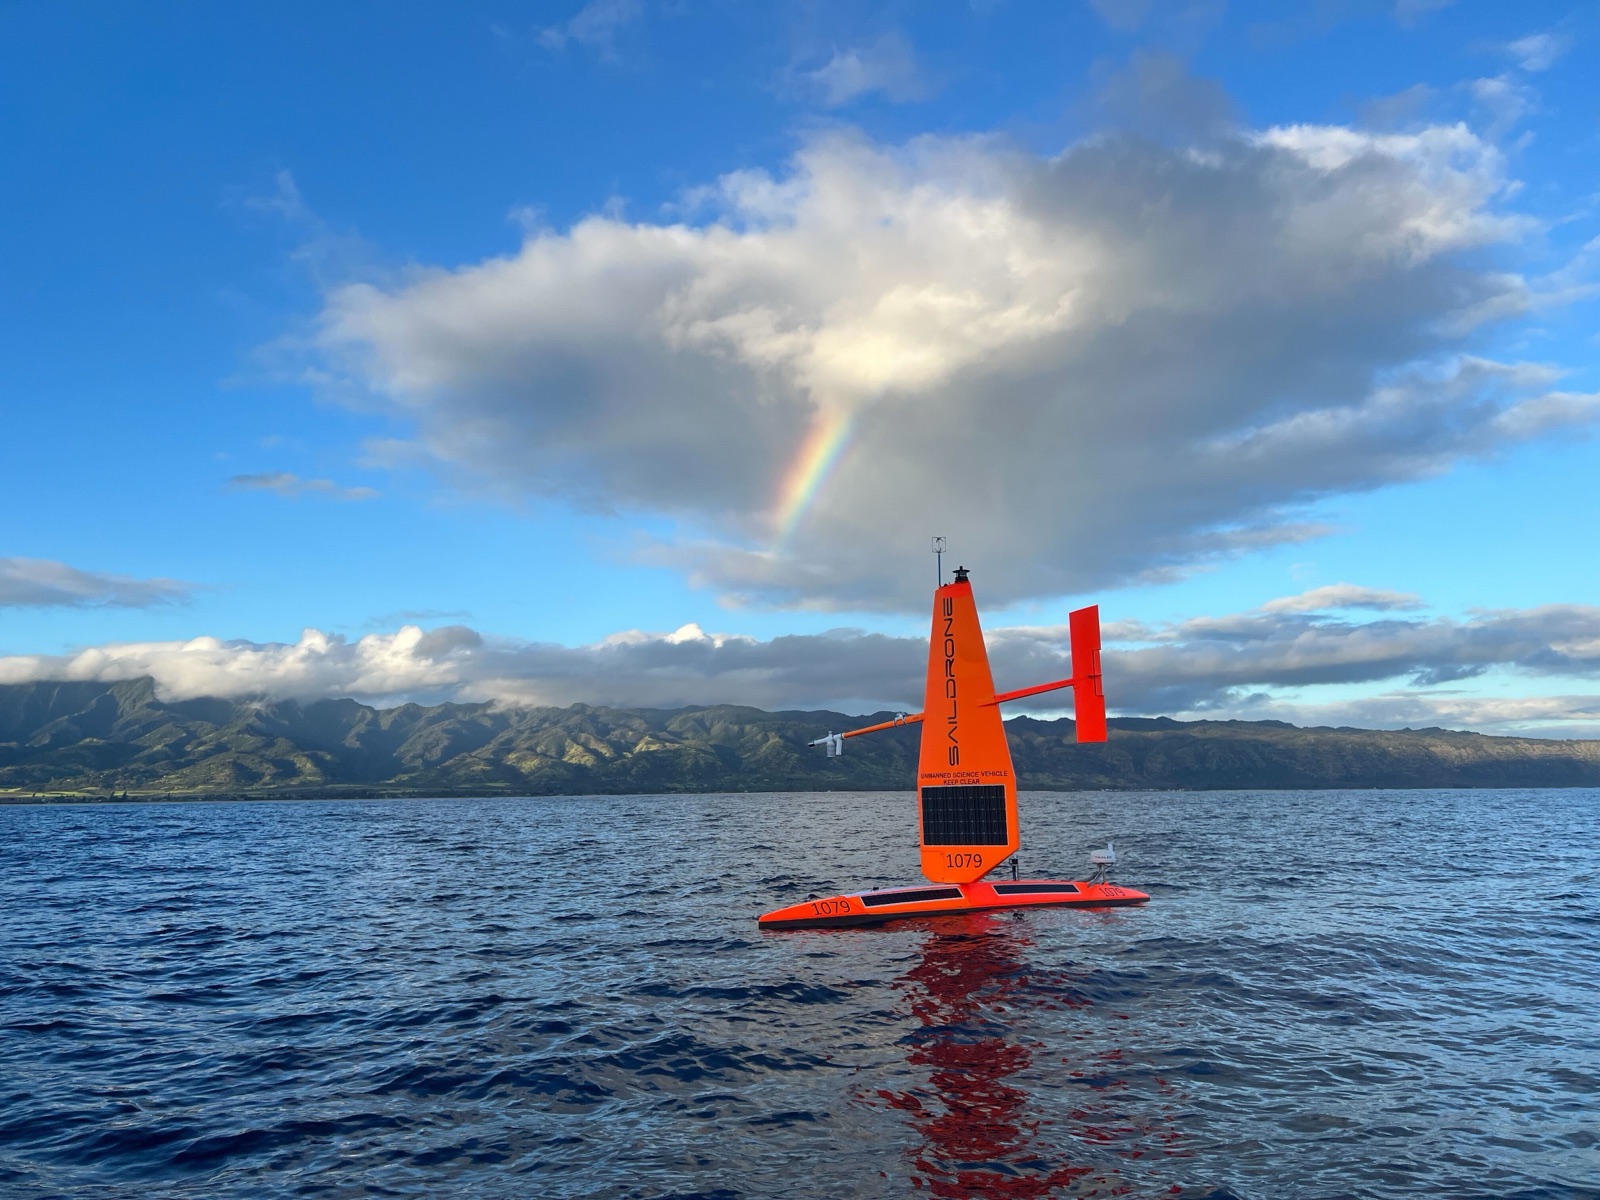
A Saildrone Explorer is a seven-metre hull under a rigid wing. The wind drives it and the sun powers its instruments, so it can hold a course for months with no ship, no crew and no fuel.
The mission was supported by NOAA's Office of Marine and Aviation Operations and Saildrone, Inc., and run with NOAA Fisheries' Pacific Islands Fisheries Science Center, to find out whether one voyage can survey the physics of the ocean and the fish in it at once.
Five months at sea
The map follows SD1030, from the launch site to the equator and home. Scroll through the steps: the track draws itself, and the marker at its head is where the drone had got to.
The central Pacific
Three saildrones left Hawaiʻi on 24 May 2023 for sea trials, and a three-day comparison with the WHOTS mooring north of Oʻahu. Their study region lay some 2,000 km to the south, on the equator in the middle of the Pacific.
Setting out
The mission proper began on 22 June, when the drones reached the launch site near 18°N, 155°W. SD1030's first days out were in the coolest water of its whole voyage, 25.4 °C.
South along 155°W
For almost four weeks it sailed south. It spent two days beside the TAO mooring at 8°N and two more at 5°N, checking its sensors against the buoys', then ran east along 5°N before turning south again. The sea warmed all the way, to 28.3 °C at the equator.
On the equator
It reached the equator on 17 July near 153.5°W, where the three drones sailed in formation to measure upwelling, the cold water that rises along the equator: two in nested boxes 22 km and 16 km across, the third in a butterfly inside them. SD1030 then worked the water up to 4°N, and in early September moved to the TAO buoy at 0°, 155°W. There, navigational problems kept it from following the other two west, and on 12 September it went off mission.
The way home
It sailed for Hawaiʻi on a track west of the one it came down, through the warmest water it met: 30.0 °C on 29 September, at 4.5°N. It passed the 8°N mooring again on 7 October, and reached the waters off Oʻahu on 12 November, 144 days and at least 7,800 km after it set out.
What it measured
The same track, coloured by the temperature of the sea surface along it: coolest off Hawaiʻi, and never below 28 °C south of 5°N. It's grey for a few legs in mid-October, when SD1030 recorded none. Point at the track, or tap it, to read any of its six-hourly positions.
Seen from space
The sea on 29 September, the day SD1030 met its warmest water, as the Met Office's OSTIA analysis has it: a daily map with no gaps, made from what satellites, ships and buoys measured. Water above 29 °C, the warm pool of the western Pacific, reached along the equator as far as 165°W, and the sea cooled east of it. Where the drone logged 30.0 °C, OSTIA has 29.8 °C. Along the whole track, the two differ by 0.14 °C on average.
El Niño, in the sea level
Satellites measure the height of the sea as well. This map shows how far it stood above or below its 1993–2012 average on 31 August. Most of it is higher, because the oceans have risen since then. The dark band along the equator is El Niño: the trade winds, which pile warm water up in the western Pacific, had weakened, and the water flowed back east. Where SD1030 was working, the sea stood 20 cm above its average. Between 5°S and 5°N, it stood 19 cm above it on average from 150°W to 90°W, and 1 cm from 140°E to 160°E.
What they carried
Each of these missions, PMEL writes, has shown that the drones can measure the exchange of heat, momentum and carbon dioxide between the sea and the air at high resolution, along with the weather, the physics and the chemistry of the water, "over distances ranging from meters to thousands of kilometers".
Two of the three carried an acoustic Doppler current profiler, which measured the currents from the surface down to about 80 m. SD1079 carried something new: an EK80 echosounder, which reads the water column with sound. It monitored the biomass of organisms at several levels of the food web, to test whether a drone can make surveys that have needed a ship.
Along the way they sailed beside instruments that their readings could be checked against: the WHOTS mooring north of Oʻahu, the TAO moorings at 8°N, 5°N and the equator on 155°W, and, on 9 October, the French research vessel Antea, which two of the drones met on the equator near 166°W.
An El Niño summer
The mission sailed into a developing El Niño. Along the equator, the winds drive the surface water apart and colder water rises from below to replace it. During El Niño the easterly winds relax, that upwelling weakens, and the surface of the central Pacific warms.
The warm pool of the western Pacific, water above 28 to 29 °C, spreads east with it. As the mission began, its eastern edge was nearing the equator at 155°W, on the drones' route, and the study region was moved east to meet it. SD1030's log shows how far it had come: south of 5°N, the drone never recorded a sea surface below 28 °C. The last two steps of the map show it from space: the warm pool on 29 September, and on 31 August the sea that El Niño had raised in the east.
After SD1030 left, the other two went on: west along the equator, north to 6°N on 170°W, and back east on the North Equatorial Counter Current, which carried them almost 5° of longitude in five days before the mission ended on 5 November. PMEL's conclusion was that such currents should be treated as "highways" when a route is planned.
Credits
Track data: NOAA PMEL TPOS 2023 Saildrone 1030, in the public domain (CC0). The account of the mission follows NOAA PMEL's OCS Saildrone Mission: TPOS 2023 log. With thanks to the Ocean Climate Station Project Office of NOAA/PMEL. The moorings are drawn at their nominal positions.
The sea surface temperature is the Met Office's OSTIA analysis, and the sea level anomaly comes from DUACS satellite altimetry, measured against the 1993–2012 average. Both were generated using E.U. Copernicus Marine Service information (OSTIA: reprocessed and near real time; DUACS: reprocessed and near real time), and OceanStream serves them as map tiles.
The base map is the EMODnet Bathymetry World Base Layer (CC BY 4.0), which shows the depth of the sea from EMODnet Bathymetry and, outside European seas, the GEBCO 2019 Grid. It isn't for navigation. The labels are set in Noto Sans, served by OpenFreeMap.
This page is a storymap on a story layout, written in Markdown. Mapping a mission shows how it's made.