Mapping a mission
A saildrone in the Pacific follows an uncrewed vessel for five months, on a globe. Its track draws itself as the reader scrolls, with a marker at its head. The camera tilts to look down the meridian it sailed. Then the track turns into a temperature section, with a legend and a readout under the pointer, and the last two steps lay it on satellite maps of the sea.
All of it is one Markdown file, a GeoJSON file of 96 kB and free tile services. This page builds it from the raw data. It's written for people who work with geospatial data: it assumes you know what a tile source is, and how a style expression reads.
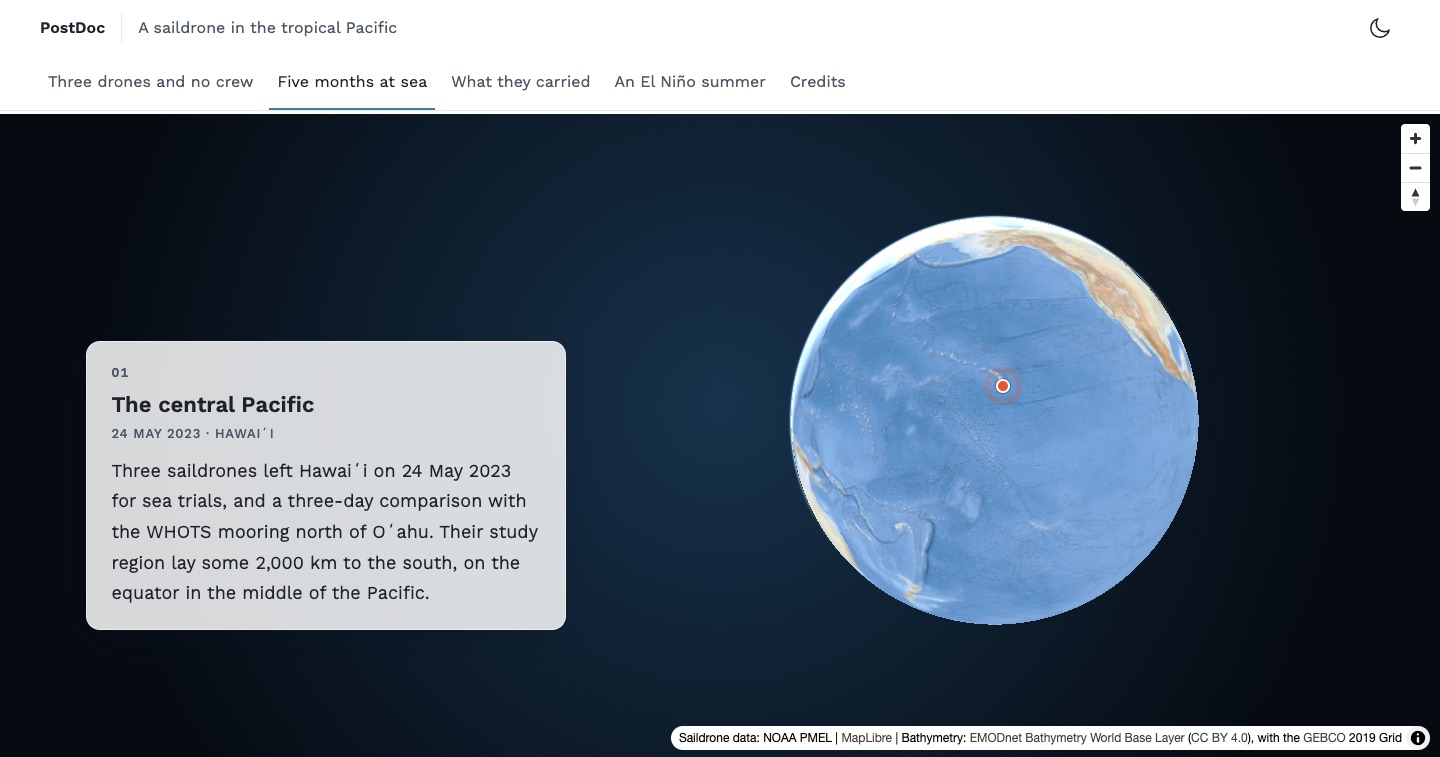
Open the full-screen story (new tab)
What a storymap is made of
Three things, all of them declared rather than programmed:
- A base map: a MapLibre style.
- Sources and layers: your data, and how to draw it.
- Steps: headings, each with the view, the time and the layers it shows.
Postdoc hands the first two to MapLibre GL JS as they are. So what you know of its style specification holds here: every kind of source and layer, filters, zoom ranges, and expressions that draw from the data. Postdoc adds what a story needs on top of the map: steps that follow the scroll, a timeline, legends and readouts.
There is no JavaScript to write, and no build step of your own. The map's code is loaded only on the pages that have a map.
1. The data: a track with time
SD1030 reported once a minute for five months. NOAA PMEL publishes the records on its ERDDAP server, which can thin them out before they're sent: orderByClosest("time,6 hours") returns the record closest to every sixth hour. This script asks for those and writes the track:
"""Builds a storymap track from a NOAA ERDDAP dataset: one line for every six hours
that the vehicle sailed, with the time it ended and the temperature of the sea there."""

import csv
import io
import json
import math
import urllib.parse
import urllib.request

DATASET = 'https://data.pmel.noaa.gov/pmel/erddap/tabledap/sd1030_tpos_2023.csv'
# ERDDAP thins the one-minute records out on the server: the one closest to every sixth hour.
QUERY = 'time,latitude,longitude,TEMP_SBE37_MEAN&orderByClosest("time,6 hours")'

with urllib.request.urlopen(f'{DATASET}?{urllib.parse.quote(QUERY, safe="&,")}') as response:
    # The second line of an ERDDAP CSV file holds the units.
    rows = list(csv.DictReader(io.TextIOWrapper(response, 'utf-8')))[1:]

# Before it's launched and after it's recovered, a vehicle has no position.
fixes = [row for row in rows if row['latitude'] != 'NaN']


def position(row):
    return [round(float(row['longitude']), 4), round(float(row['latitude']), 4)]


def temperature(row):
    value = float(row['TEMP_SBE37_MEAN'])

    return None if math.isnan(value) else round(value, 2)


def point(row, kind):
    return {
        'type': 'Feature',
        'properties': {'time': row['time'], 'kind': kind},
        'geometry': {'type': 'Point', 'coordinates': position(row)}
    }


# A feature for each leg, with the time it ended at: the timeline shows the legs up to a
# time, and the colour of a leg can follow its temperature.
legs = [{
    'type': 'Feature',
    'properties': {'time': end['time'], 'temperature': temperature(end)},
    'geometry': {'type': 'LineString', 'coordinates': [position(start), position(end)]}
} for start, end in zip(fixes, fixes[1:])]

with open('sd1030-tpos-2023.geojson', 'w') as file:
    json.dump({
        'type': 'FeatureCollection',
        'features': [*legs, point(fixes[0], 'start'), point(fixes[-1], 'end')]
    }, file, separators=(',', ':'))

print(f'{len(legs)} legs, from {fixes[0]["time"]} to {fixes[-1]["time"]}')
It needs nothing but Python, and writes the file that the story uses: 556 legs and two points, in 96 kB. The file goes in the site's public folder, as data/sd1030-tpos-2023.geojson.
The shape of the data is what makes the rest possible:
{
  "type": "Feature",
  "properties": { "time": "2023-06-22T00:00:00Z", "temperature": 25.87 },
  "geometry": { "type": "LineString", "coordinates": [[-154.9582, 18.0681], [-154.9585, 18.1056]] }
}- A feature for each leg, rather than one line for the whole voyage. A filter can then show the legs up to a time, and a paint expression can give each its own colour.
- The time a leg ended at, as an ISO 8601 time in UTC. Times written that way sort as text, which is how the map compares them.
- Four decimals in the coordinates, about 11 m. More would only make the file bigger.
Tip
A track of millions of points belongs in vector tiles. tippecanoe writes a single PMTiles file that any static host can serve, and a source reads it from a pmtiles:// URL. Steps show their part of a timeline from tiles too. Only the running of the time between the steps, and the marker, need GeoJSON, which Postdoc reads the times and the positions from.
2. The base map
A base map is a MapLibre style. For a raster tile service, the whole style is a few lines. This is the one behind the story: the EMODnet Bathymetry world base layer.
{
  "version": 8,
  "name": "EMODnet Bathymetry",
  "glyphs": "https://tiles.openfreemap.org/fonts/{fontstack}/{range}.pbf",
  "sources": {
    "bathymetry": {
      "type": "raster",
      "tiles": [
        "https://tiles.emodnet-bathymetry.eu/2020/baselayer/web_mercator/{z}/{x}/{y}.png"
      ],
      "tileSize": 256,
      "maxzoom": 12,
      "attribution": "Bathymetry: <a href=\"https://doi.org/10.12770/386fe2aa-84c4-4cea-9e22-fcba4d5f2e75\">EMODnet Bathymetry World Base Layer</a> (<a href=\"https://creativecommons.org/licenses/by/4.0/\">CC BY 4.0</a>), with the <a href=\"https://www.gebco.net\">GEBCO</a> 2019 Grid"
    }
  },
  "layers": [
    {
      "id": "background",
      "type": "background",
      "paint": {
        "background-color": "#4b78b4"
      }
    },
    {
      "id": "bathymetry",
      "type": "raster",
      "source": "bathymetry"
    }
  ]
}tilesis the URL template of any XYZ or WMTS service. A WMS works as well: put{bbox-epsg-3857}where the bounding box goes in itsGetMaprequest, and MapLibre asks for one image per tile.glyphsis where the fonts of labels come from. A raster style has none of its own, so this one borrows OpenFreeMap's.attributionshows on the map. A licence such as CC BY asks for it.
The dark variant is the same style with the tiles dimmed, by raster-brightness-max and raster-saturation in the layer's paint. Both are set once for the site, and every storymap starts from them:
export default {
  storymap: {
    style: {
      light: '/map-styles/emodnet-bathymetry.json',
      dark: '/map-styles/emodnet-bathymetry-dark.json'
    }
  }
};
The map follows the site between light and dark, and keeps its data, its view and its step when it changes.
3. Sources and layers
The storymap's settings are a YAML block at its start. The track is a source and three layers:
sources:
  sd1030:
    type: geojson
    data: /data/sd1030-tpos-2023.geojson
    attribution: 'Saildrone data: NOAA PMEL'
layers:
  - id: track-halo
    type: line
    source: sd1030
    filter: ['==', ['geometry-type'], 'LineString']
    layout: { line-cap: round, line-join: round }
    paint: { line-width: 6, line-color: '#ffffff', line-opacity: 0.4 }
  - id: track
    type: line
    source: sd1030
    filter: ['==', ['geometry-type'], 'LineString']
    layout: { line-cap: round, line-join: round }
    paint: { line-width: 2.5, line-color: '#1b1f24' }
  - id: start-and-end
    type: circle
    source: sd1030
    filter: ['==', ['geometry-type'], 'Point']
    paint: { circle-radius: 5, circle-color: '#ffffff', circle-stroke-width: 2, circle-stroke-color: '#1b1f24' }
A dark line reads on a light sea and a pale halo keeps it readable on a dark one, so the same layers serve both colour schemes. The source holds lines and points, and each layer filters for its own.
Small data can be written straight into the settings. The moorings that the drones were checked against are four points, with a circle and a label for each, both hidden until the map is close enough to tell them apart. These are two of the points, and the layer of the labels:
sources:
  moorings:
    type: geojson
    data:
      type: FeatureCollection
      features:
        - { type: Feature, properties: { name: WHOTS }, geometry: { type: Point, coordinates: [-158, 22.75] } }
        - { type: Feature, properties: { name: 'TAO 8°N' }, geometry: { type: Point, coordinates: [-155, 8] } }
layers:
  - id: mooring-names
    type: symbol
    source: moorings
    minzoom: 3.5
    layout: { text-field: [get, name], text-font: ['Noto Sans Regular'], text-size: 12, text-anchor: left, text-offset: [0.9, 0] }
    paint: { text-color: '#ffffff', text-halo-color: 'rgba(13, 35, 54, 0.85)', text-halo-width: 1.4 }
4. Steps and the camera
Each heading of the storymap is a step, and the braces after it say what the map shows when the reader gets there:
### The central Pacific {center="-157,10" zoom=1.6 until="2023-06-21"}

### Setting out {center="-156.6,19.4" zoom=5.3 until="2023-06-22"}

### South along 155°W {center="-154.4,8.4" zoom=4.55 pitch=40 bearing=-8 until="2023-07-17" duration=4500}

### On the equator {bounds="-155.7,-0.5,-153.1,4.2" until="2023-09-12" duration=4000}

### The way home {bounds="-158.9,-0.4,-154.2,21.7" until="2023-11-12" duration=5000}

### What it measured {bounds="-158.9,-0.5,-153.1,21.8" show="temperature"}

### Seen from space {center="-163,2" zoom=2 show="sst"}

### El Niño, in the sea level {center="-160,2" zoom=1.85 show="sla"}centerandzoomgo to a place.boundsfits an area instead, west, south, east and north, whatever the size of the map: the same step works beside the text of a page, and under a card that covers a third of a window.pitchandbearingtilt and turn the map. The third step tilts it until the meridian runs away to a horizon, so the voyage south comes towards the reader.durationis how long the move takes, in milliseconds, andspeedhow fast it flies. The legs are long, so their steps take four or five seconds, and the eye can follow the track.
A view is complete in itself. A step that doesn't tilt the map sees it from above with north up, whatever the step before it did, so scrolling back up shows what the reader saw on the way down.
Postdoc keeps what a step shows clear of what covers the map. On a story page, where the steps float over the map as cards, a place is centred in the room beside the card, and an area is fitted into it. A legend takes its share of the room as well.
5. Time
A timeline names the layers whose features hold a time, and the property that holds it:
timeline:
  property: time
  layers: [track-halo, track, temperature, start-and-end]
  marker: true
A step's until then shows those layers up to a date or a time. The first step shows the track until="2023-06-21", which is only its starting point, and the fifth until="2023-11-12", which is all of it.
Between two steps, the time runs from the one to the other. The track draws itself as the map flies, forwards when the reader scrolls down and backwards when they scroll up. With marker: true, a marker stays at the head of it: the end of the latest leg.
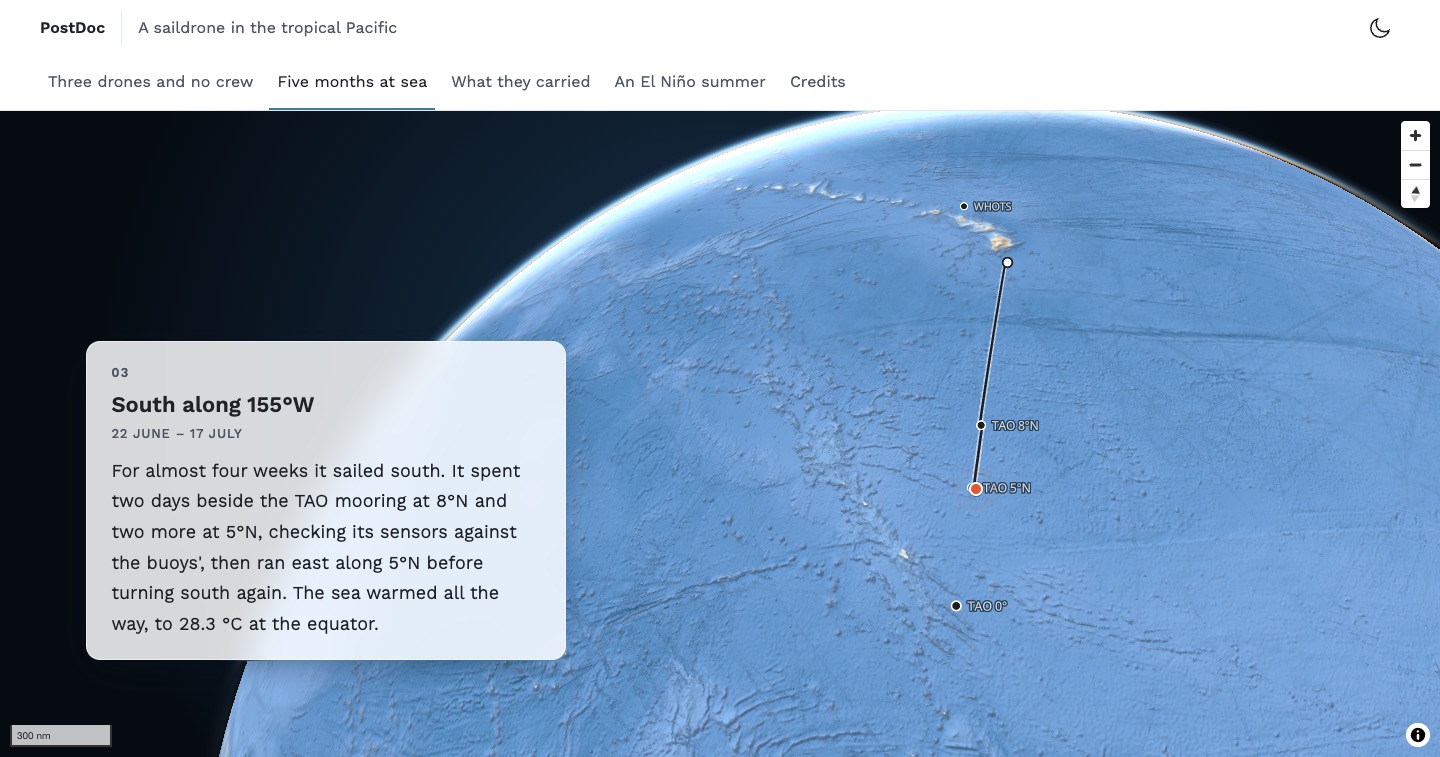
A step can open a window on the timeline with from as well, to show one leg of a voyage and not the ones before it:
### On the equator {bounds="-155.7,-0.5,-153.1,4.2" from="2023-07-17" until="2023-09-12"}Readers who ask their system for less motion get each step's time at once, with the map already there.
6. A layer that a step reveals
The dark track says where the drone went. What it measured there is another layer over the same source, with a colour for each leg, taken from its temperature:
- id: temperature
  type: line
  source: sd1030
  filter: ['==', ['geometry-type'], 'LineString']
  layout: { line-cap: round, line-join: round, visibility: none }
  paint:
    line-width: 4
    line-color: [case, ['==', [get, temperature], null], '#8a949e', [interpolate, [linear], [get, temperature], 25.5, '#fff3b2', 27, '#fdbb63', 28.5, '#ee6a4c', 30, '#b5174b']]
visibility: none hides it, and the sixth step shows it with show="temperature". The expression is MapLibre's own: grey where the drone recorded no temperature, and otherwise a colour between the stops on either side of the value.
A legend says what the colours mean. It takes the same stops, and names the layer that it shows with, so it appears with the sixth step and not before:
legend:
  title: Sea surface temperature, °C
  layer: temperature
  stops:
    - [25.5, '#fff3b2']
    - [27, '#fdbb63']
    - [28.5, '#ee6a4c']
    - [30, '#b5174b']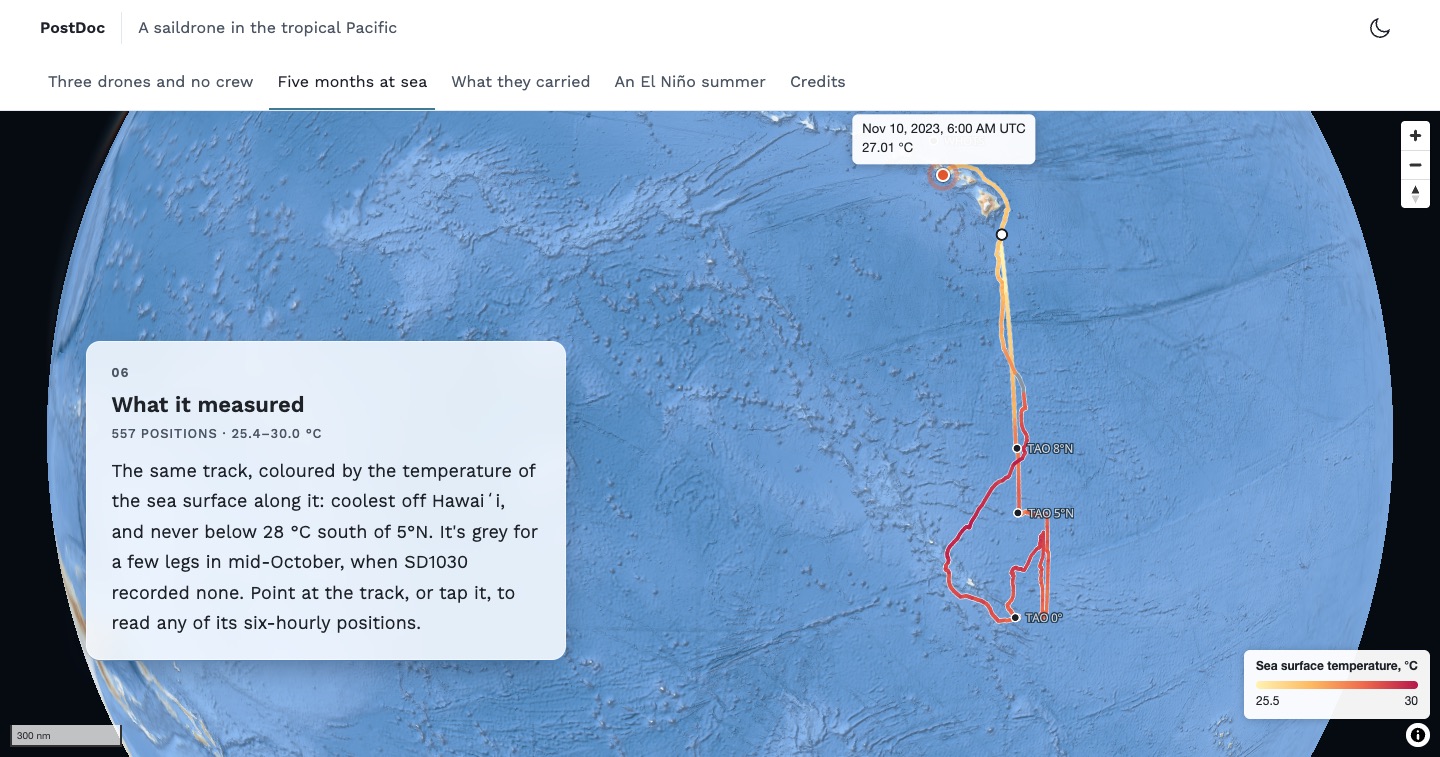
7. Satellite layers
The last two steps lay the track on maps of the whole sea: its temperature on one day of the voyage, and its height on another. Both are daily satellite products of the E.U. Copernicus Marine Service, which OceanStream serves as XYZ tiles, coloured on request. So each is a raster source, with the day in its URL and the range of its colours in the query:
sources:
  sst:
    type: raster
    tiles: ['https://globe.oceanstream.io/api/tiles/sst/2023-09-29/{z}/{x}/{y}.png?vmin=20&vmax=33&contours=false']
    tileSize: 256
    maxzoom: 8
    attribution: 'Sea temperature and sea level: Copernicus Marine Service, via OceanStream'
  sla:
    type: raster
    tiles: ['https://globe.oceanstream.io/api/tiles/sla/2023-08-31/{z}/{x}/{y}.png?vmin=-0.25&vmax=0.25&contours=false']
    tileSize: 256
    maxzoom: 8
    attribution: 'Sea temperature and sea level: Copernicus Marine Service, via OceanStream'
layers:
  - { id: sst, type: raster, source: sst, layout: { visibility: none } }
- { id: sla, type: raster, source: sla, layout: { visibility: none } }- The day is in the path:
sst/2023-09-29is the sea surface temperature of 29 September 2023, from the Met Office's OSTIA analysis, which the server has from 1991 on.slais the sea level anomaly from satellite altimetry, which it has from 1993 on. vminandvmaxare the ends of the colour scale: 20 to 33 °C spreads the colours over the temperatures of the tropics, and ±0.25 m over the heights of an El Niño.contours=falseleaves out the contour lines that the server draws by default.tileSize: 256, because MapLibre takes raster tiles to be 512 pixels unless told otherwise.maxzoom: 8is the deepest zoom the server has. MapLibre enlarges its tiles beyond it.- The layers come first, so they're drawn under the track. Land is transparent in the tiles, so the coasts of the base map show through.
- Two sources with the same
attributionshow it once, and only while one of their layers is on the map.
Each layer has a legend, and legend takes a list of them. A legend shows with the layer that it names, so each step has only its own:
legend:
  - title: Sea surface temperature on 29 September, °C
    layer: sst
    stops:
      - [20, '#032333']
      - [22, '#25338e']
      - [24, '#6a4495']
      - [26, '#a05a87']
      - [28, '#d96d68']
      - [30, '#fa973f']
      - [32, '#f4d848']
      - [33, '#e8f859']
  - title: Sea level anomaly on 31 August, cm
    layer: sla
    stops:
      - [-25, '#171c42']
      - [-20, '#293c92']
      - [-15, '#136ebb']
      - [-10, '#569aba']
      - [-5, '#a6c0c9']
      - [0, '#eeeaea']
      - [5, '#dcb3a6']
      - [10, '#cb7a5f']
      - [15, '#b43a27']
      - [20, '#820e29']
      - [25, '#3e0913']
The server colours its tiles with cmocean's thermal and balance scales, and the colours of the stops were read off its tiles, so the legends match the maps. A legend's values only place its colours and label its ends, so the sea level's can be in centimetres while the tiles ask for metres.
Tip
OceanStream describes each layer in a TileJSON, such as /api/tiles/sst/tilejson/2023-09-29.json, with its unit, its colour scale and the range it's coloured over by default. Its point endpoint gives the value at a position, such as /api/sst/point?date=2023-09-29&lon=-157.49&lat=4.46, which is how the numbers in the two steps were checked.
8. A readout under the pointer
popups gives a layer a line of text to show for the feature under the pointer, or under a tap. Its placeholders are properties of the feature:
popups:
  track-halo: "{time|datetime} UTC\n{temperature|2} °C"
{time|datetime} shows a time as a date and a time in UTC, in the language of the page, and {temperature|2} a number with two decimals. A property that a feature doesn't have shows as a dash.
The popup is on the halo and not on the track, because the halo is the wider of the two. Postdoc looks a few pixels around the pointer as well, so a thin line isn't hard to point at.
9. The globe
One line turns the map into a globe:
projection: globeZoomed out, the Earth is a sphere in space, with an atmosphere at its edge. Zoomed far in, it's the flat map again. Nothing else changes: the same views, the same data. The story opens at zoom=1.6, which shows the whole of it, and its last two steps come back out to the Pacific. The others use it more quietly: the meridians converge, and the tilted third step has a horizon.
What shows around the globe is the --storymap-sky custom property, for a theme to set. A style can have a sky of its own, in place of the atmosphere that Postdoc gives a globe.
10. Controls and limits
controls:
  compass: true
  scale: nautical
map:
  minZoom: 1
  maxZoom: 9
The zoom buttons are always there, unless zoom: false takes them off. The compass is worth adding to a map that steps turn: it shows where north is and puts it back. The scale is in kilometres, miles or, as at sea, nautical miles.
map passes any other option of the MapLibre map through: here, limits on how far a reader can zoom between the steps. The story doesn't set any.
Readers can always explore the map between the steps. Scrolling the page doesn't zoom it, though: that takes Ctrl and the wheel, or two fingers, so the page never gets stuck on the map.
11. One story, two layouts
The same storymap is on two pages. In this guide it's docked: the steps beside the map, as part of a page. On its story page it floats, the map filling the window with the steps as cards over it. Nothing in the storymap differs. The story page asks for floating storymaps, and a storymap's own layout setting would overrule it.
Story pages says how to make one.
The whole map
These are the settings of the story as they are in its page, before the steps:
projection: globe
controls:
  compass: true
  scale: nautical
sources:
  sd1030:
    type: geojson
    data: /data/sd1030-tpos-2023.geojson
    attribution: 'Saildrone data: NOAA PMEL'
  moorings:
    type: geojson
    data:
      type: FeatureCollection
      features:
        - { type: Feature, properties: { name: WHOTS }, geometry: { type: Point, coordinates: [-158, 22.75] } }
        - { type: Feature, properties: { name: 'TAO 8°N' }, geometry: { type: Point, coordinates: [-155, 8] } }
        - { type: Feature, properties: { name: 'TAO 5°N' }, geometry: { type: Point, coordinates: [-155, 5] } }
        - { type: Feature, properties: { name: 'TAO 0°' }, geometry: { type: Point, coordinates: [-155, 0] } }
  sst:
    type: raster
    tiles: ['https://globe.oceanstream.io/api/tiles/sst/2023-09-29/{z}/{x}/{y}.png?vmin=20&vmax=33&contours=false']
    tileSize: 256
    maxzoom: 8
    attribution: 'Sea temperature and sea level: Copernicus Marine Service, via OceanStream'
  sla:
    type: raster
    tiles: ['https://globe.oceanstream.io/api/tiles/sla/2023-08-31/{z}/{x}/{y}.png?vmin=-0.25&vmax=0.25&contours=false']
    tileSize: 256
    maxzoom: 8
    attribution: 'Sea temperature and sea level: Copernicus Marine Service, via OceanStream'
layers:
  - { id: sst, type: raster, source: sst, layout: { visibility: none } }
  - { id: sla, type: raster, source: sla, layout: { visibility: none } }
  - id: track-halo
    type: line
    source: sd1030
    filter: ['==', ['geometry-type'], 'LineString']
    layout: { line-cap: round, line-join: round }
    paint: { line-width: 6, line-color: '#ffffff', line-opacity: 0.4 }
  - id: track
    type: line
    source: sd1030
    filter: ['==', ['geometry-type'], 'LineString']
    layout: { line-cap: round, line-join: round }
    paint: { line-width: 2.5, line-color: '#1b1f24' }
  - id: temperature
    type: line
    source: sd1030
    filter: ['==', ['geometry-type'], 'LineString']
    layout: { line-cap: round, line-join: round, visibility: none }
    paint:
      line-width: 4
      line-color: [case, ['==', [get, temperature], null], '#8a949e', [interpolate, [linear], [get, temperature], 25.5, '#fff3b2', 27, '#fdbb63', 28.5, '#ee6a4c', 30, '#b5174b']]
  - id: start-and-end
    type: circle
    source: sd1030
    filter: ['==', ['geometry-type'], 'Point']
    paint: { circle-radius: 5, circle-color: '#ffffff', circle-stroke-width: 2, circle-stroke-color: '#1b1f24' }
  - id: moorings
    type: circle
    source: moorings
    minzoom: 3.5
    paint: { circle-radius: 4, circle-color: '#1b1f24', circle-stroke-width: 1.5, circle-stroke-color: '#ffffff' }
  - id: mooring-names
    type: symbol
    source: moorings
    minzoom: 3.5
    layout: { text-field: [get, name], text-font: ['Noto Sans Regular'], text-size: 12, text-anchor: left, text-offset: [0.9, 0] }
    paint: { text-color: '#ffffff', text-halo-color: 'rgba(13, 35, 54, 0.85)', text-halo-width: 1.4 }
timeline:
  property: time
  layers: [track-halo, track, temperature, start-and-end]
  marker: true
legend:
  - title: Sea surface temperature, °C
    layer: temperature
    stops:
      - [25.5, '#fff3b2']
      - [27, '#fdbb63']
      - [28.5, '#ee6a4c']
      - [30, '#b5174b']
  - title: Sea surface temperature on 29 September, °C
    layer: sst
    stops:
      - [20, '#032333']
      - [22, '#25338e']
      - [24, '#6a4495']
      - [26, '#a05a87']
      - [28, '#d96d68']
      - [30, '#fa973f']
      - [32, '#f4d848']
      - [33, '#e8f859']
  - title: Sea level anomaly on 31 August, cm
    layer: sla
    stops:
      - [-25, '#171c42']
      - [-20, '#293c92']
      - [-15, '#136ebb']
      - [-10, '#569aba']
      - [-5, '#a6c0c9']
      - [0, '#eeeaea']
      - [5, '#dcb3a6']
      - [10, '#cb7a5f']
      - [15, '#b43a27']
      - [20, '#820e29']
      - [25, '#3e0913']
popups:
  track-halo: "{time|datetime} UTC\n{temperature|2} °C"
Before you publish
- Credit the data and the tiles. An
attributionon a source shows on the map, behind the ⓘ button once the reader has scrolled on. Say it in the page as well, with the licence. - Tell the story in the steps. A legend and a readout are for those who can see and point at the map. What matters has to be in the words, which reach every reader, with or without the map.
- Run
npx postdoc test. It opens the page in a browser and checks it for accessibility, map and all.
The reference lists every attribute and setting.